17.4 Testing the Storefront Application
The Storefront application represents a typical shopping-cart application that you might encounter on the Internet or may even have built before. A normal application of this type would connect to a database with tens of thousands or even hundreds of thousands of records.
|
There's no real point in going through the entire exercise of testing the Storefront application; the numbers wouldn't mean anything anyway. It would, however, be helpful to show how to get started and what steps must usually be taken to get performance numbers out of an application. The following are the general steps:
1. Understand the performance goals.
2. Establish the performance baselines for the application.
3. Run tests to collect performance data.
4. Analyze the data to detect where the problems are.
5. Make the necessary software and hardware changes to increase performance.
6. Repeat Steps 3 through 5 as necessary to reach the performance goals.
This section works through each of these steps. For this exercise, we are going to use a scaled-down version of the Mercury Interactive LoadRunner product, called Astra LoadTest. This is a feature-rich commercial product. A demo version that will support up to 10 virtual users is available for download at http://www-svca.mercuryinteractive.com/products/downloads.html.
17.4.1 Understand the Performance Goals
Before you begin testing, it's important to understand the performance goals of the application. The performance goals are normally specified in the nonfunctional requirements for an application, using the following units:
· Average transaction response time
· Transactions per second (tps)
· Hits per second
It's not absolutely critical that you know what the performance numbers need to be before starting to test the application, but it can help to have a set of expectations. Sooner or later, someone is going to ask you how the application performs. To be able to say "it's good" or "it stinks," you'll need to evaluate its performance relative to some set of goals.
17.4.2 Establish a Performance Baseline
Once you're ready to start testing, the first thing you should do is establish a baseline. A baseline is a snapshot of your application's performance before anything has been done to it. It's always a good idea to get a performance baseline before you start changing code to improve the performance. Otherwise, how do you know whether you've made it better or worse?
17.4.2.1 Taking a baseline
Most performance-testing tools allow you to record the interaction sequence between a browser and the web application. Although most tools also allow you to manually create the testing scripts, using the tools' automatic recording aspects is very convenient. Figure 17-1 illustrates the recording screen of the Astra LoadTest software.
Figure 17-1. The recording screen of the Astra LoadTest application
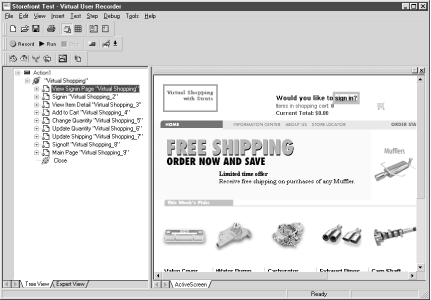
With Astra, as with most other web testing tools, each interaction with the web application can be recorded as a separate transaction. In Figure 17-1, each element in the tree view on the left-hand side of the screen represents a separate transaction that can be played back and have its performance metrics recorded.
Once you start recording, all interaction between the client and the server is recorded, including request parameters and headers. You can then play back this recording and modify different parameters, such as the number of users executing the recording.
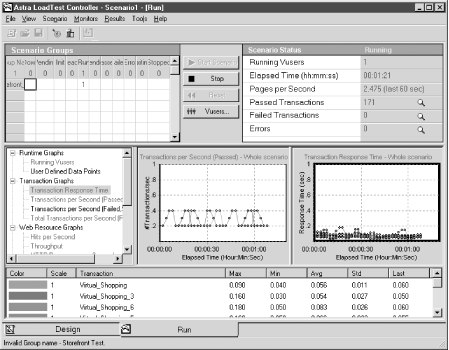
Once you have the necessary test scripts, you can establish the baseline. The baseline measurement is normally taken with a single user using the application. Depending on whether you are conducting performance tests or are concentrating on load testing, the number of virtual users can vary. It's typically a good idea to start with one user and scale upward. If the application is slow with a single user, it's likely to be slow with multiple users. Figure 17-2 shows the testing script from Figure 17-1 running against the Storefront application with a single user.
Figure 17-2. Testing the Storefront application with a single user
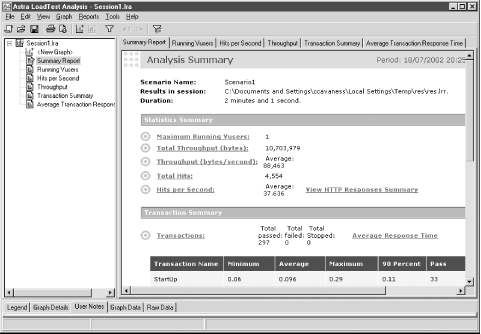
Once the testing scenario is complete, the software gives you a summary report of the performance of your application. The baseline report for the Storefront application with a single user is shown in Figure 17-3.
Figure 17-3. The summary report for the Storefront application
Once you have the baseline numbers, if you determine that the performance needs to improve, you can start to modify the application. Unfortunately, this is never easy. You have to know where the problems are in order to determine where to focus. There's not much point in speeding up the application in the places that it's already fast. You need to use the tools to help you determine where the bottlenecks are.
17.4.3 Find the Trouble Areas
Sometimes you get lucky and find the performance problems quickly. Other times, you need to use different tools to locate and isolate the areas that are causing the problems. This is where profiling tools can help.
Profiling your application is somewhat different from conducting the performance tests that we've been discussing. Although performance tools might be able to tell you which web request took the longest to complete, they can't tell you which Java method took up the most time. This is the purpose of profilers.
Table 17-2 lists several profiling tools that can be useful in locating trouble areas of the application.
Table 17-2. Commercially available profiling tools |
||
|
Company |
Product |
URL |
|
Rational |
Quantify |
|
|
Inprise |
OptimizeIt |
|
|
Sitraka Software |
JProbe |
|
Profiling an application is similar to debugging. You see where the application spends most of its time, how many calls are made to a specific function, how many objects are created, how much memory is used, and so on. You start from a high level and work your way down to the methods that are causing the performance or scalability problems. Once you fix the problem areas, you run the tests again. This is repeated until all of the problems are resolved, or until you have to ship the product.
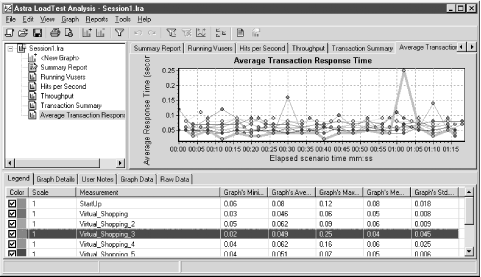
The performance tools can also help you determine where the problem areas are. In Figure 17-4, for instance, we see that the average transaction response time for one action seems much higher than those for the others.
Figure 17-4. Higher average response times may indicate a problem
|
The operation that shows the worst response time in Figure 17-4 is the "view item detail" action. With Astra, we can break the transaction down even further to see what's going on. Figure 17-5 breaks down the view item detail page into its constituent parts.
Figure 17-5. The item detail page broken down into its parts
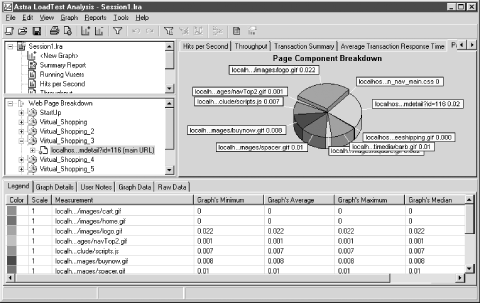
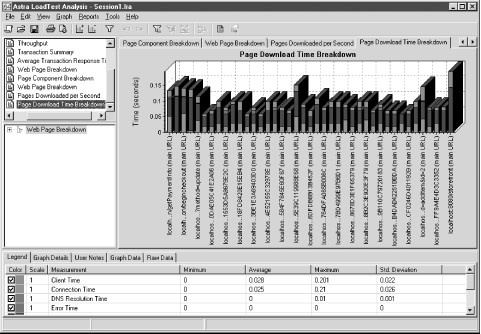
Next, we might try looking at the download times of the various pages to see how the item detail page stacks up. The download times are shown in Figure 17-6.
Figure 17-6. Page download times of the Storefront application
As you can see, tracking down performance problems involves some detective work. You have to look behind every corner and leave no stone unturned.
17.4.4 Make the Necessary Changes to Software and Hardware
Once you think you've found the problem and made the necessary changes, go back to the testing scripts once again. Keep doing this over and over until all of the performance issues are solved or it's time to ship the product. Because time is limited, it's vital that you plan your testing activities to cover the largest areas of the application and to focus on specific components that are known to cause performance or scalability problems.
There's usually not just one problem to fix—it's a constant back-and-forth process that could go on forever, except for the fact that you eventually have to ship the product. It's imperative that you concentrate on the biggest performance areas first.
