Chapter 4. Downloading and Debugging
I can remember the exact instant when I realized that a
large part of my life from then on was going to be spent in finding mistakes
in my own programs.
—Maurice Wilkes, Head of the Computer Laboratory of the
University of Cambridge, 1949
Once you have an executable binary image stored as a file on
the host computer, you will need a way to download that image to the embedded
system and execute it. The executable binary image is usually loaded into a
memory device on the target board and executed from there. And if you have the
right tools at your disposal, it will be possible to set breakpoints in the
program or to observe its execution in less intrusive ways. This chapter
describes various techniques for downloading, executing, and debugging embedded
software.
4.1 When in ROM ...
One of the most obvious ways to download your embedded
software is to load the binary image into a read-only memory device and insert
that chip into a socket on the target board. Obviously, the contents of a truly
read-only memory device could not be overwritten. However, as you'll see in
Chapter
6, embedded systems commonly employ special read-only memory devices that
can be programmed (or reprogrammed) with the help of a special piece of
equipment called a device programmer. A device programmer is a computer system
that has several memory sockets on the top—of varying shapes and sizes—and is
capable of programming memory devices of all sorts.
In an ideal development scenario, the device programmer would
be connected to the same network as the host computer. That way, files that
contain executable binary images could be easily transferred to it for ROM
programming. After the binary image has been transferred to the device
programmer, the memory chip is placed into the appropriately sized and shaped
socket and the device type is selected from an on-screen menu. The actual device
programming process can take anywhere from a few seconds to several minutes,
depending on the size of the binary image and the type of memory device you are
using.
After you program the ROM, it is ready to be inserted into
its socket on the board. Of course, this shouldn't be done while the embedded
system is still powered on. The power should be turned off and then reapplied
only after the chip has been carefully inserted.
As soon as power is applied to it, the processor will begin
to fetch and execute the code that is stored inside the ROM. However, beware
that each type of processor has its own rules about the location of its first
instruction. For example, when the Intel 80188EB processor is reset, it begins
by fetching and executing whatever is stored at physical address FFFF0h. This is
called the reset address, and the instructions located there are collectively
known as the reset code.
If your program doesn't appear to be working, it could be
there is something wrong with your reset code. You must always ensure that the
binary image you've loaded into the ROM satisfies the target processor's reset
rules. During product development, I often find it useful to turn on one of the
board's LEDs just after the reset code has been completed. That way, I know at a
glance that my new ROM either does or doesn't satisfy the processor's most basic
requirements.
 |
Debugging Tip #1
Debugging Tip #1: One of the most primitive debugging
techniques available is the use of an LED as indicator of success or
failure. The basic idea is to slowly walk the LED enable code through
the larger program. In other words, you first begin with the LED enable
code at the reset address. If the LED turns on, then you can edit the
program, moving the LED enable code to just after the next execution
milestone, rebuild, and test. This works best for very simple, linearly
executed programs like the startup code. But if you don't have access to
a remote debugger or any of the other debugging tools described later in
this chapter, this type of debugging might be your only choice. |
|
The Arcom board includes a special in-circuit programmable
memory, called Flash memory, that does not have to be removed from the board to
be reprogrammed. In fact, software that can perform the device programming
function is already installed in another memory device on the board. You see,
the Arcom board actually has two read-only memory devices—one (a true ROM)
contains a simple program that allows the user to in-circuit program the other
(a Flash memory device). All the host computer needs to talk to the monitor
program is a serial port and a terminal program. Instructions for loading an
Intel Hex Format file, like blink.hex, into the Flash memory device are
provided in the "Target188EB Monitor User's Manual," which is included with the
board.
The biggest disadvantage of this download technique is that
there is no easy way to debug software that is executing out of ROM. The
processor fetches and executes the instructions at a high rate of speed and
provides no way for you to view the internal state of the program. This might be
fine once you know that your software works and you're ready to deploy the
system, but it's not very helpful during software development. Of course, you
can still examine the state of the LEDs and other externally visible hardware
but this will never provide as much information and feedback as a debugger.
4.2 Remote Debuggers
If available, a remote debugger can be used to download,
execute, and debug embedded software over a serial port or network connection
between the host and target. The frontend of a remote debugger looks just like
any other debugger that you might have used. It usually has a text or GUI-based
main window and several smaller windows for the source code, register contents,
and other relevant information about the executing program. However, in the case
of embedded systems, the debugger and the software being debugged are executing
on two different computer systems.
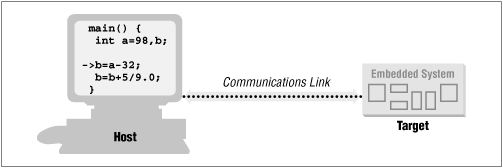
A remote debugger actually consists of two pieces of
software. The frontend runs on the host computer and provides the human
interface just described. But there is also a hidden backend that runs on the
target processor and communicates with the frontend over a communications link
of some sort. The backend provides for low-level control of the target processor
and is usually called the debug monitor.
Figure 4-1 shows how these two
components work together.

The debug monitor resides in ROM—having been placed there in
the manner described earlier (either by you or at the factory)—and is
automatically started whenever the target processor is reset. It monitors the
communications link to the host computer and responds to requests from the
remote debugger running there. Of course, these requests and the monitor's
responses must conform to some predefined communications protocol and are
typically of a very low-level nature. Examples of requests the remote debugger
can make are "read register x," "modify
register y," "read n
bytes of memory starting at address," and
"modify the data at address." The remote
debugger combines sequences of these low-level commands to accomplish high-level
debugging tasks like downloading a program, single-stepping through it, and
setting breakpoints.
One such debugger is the GNU debugger ( gdb ). Like
the other GNU tools, it was originally designed for use as a native debugger and
was later given the ability to perform cross-platform debugging. So you can
build a version of the GDB frontend that runs on any supported host and yet
understands the opcodes and register names of any supported target. Source code
for a compatible debug monitor is included within the GDB package and must be
ported to the target platform. However, beware that this port can be tricky,
particularly if you only have LED debugging at your disposal (see
Debugging Tip #1).
Communication between the GDB frontend and the debug monitor
is byte-oriented and designed for transmission over a serial connection. The
command format and some of the major commands are shown in
Table 4-1. These commands
exemplify the type of interactions that occur between the typical remote
debugger frontend and the debug monitor.
Table 4-1. GDB Debug Monitor Commands
|
Read registers |
g |
data |
|
Write registers |
Gdata |
OK |
|
Read data at address |
maddress,length |
data |
|
Write data at address |
Maddress,length:data
|
OK |
|
Start/restart execution |
c |
Ssignal |
|
Start execution from address |
caddress |
Ssignal |
|
Single step |
s |
Ssignal |
|
Single step from address |
saddress |
Ssignal |
|
Reset/kill program |
k |
no response |
Remote debuggers are one of the most commonly used
downloading and testing tools during development of embedded software. This is
mainly because of their low cost. Embedded software developers already have the
requisite host computer. In addition, the price of a remote debugger frontend
does not add significantly to the cost of a suite of cross-development tools
(compiler, linker, locator, etc.). Finally, the suppliers of remote debuggers
often desire to give away the source code for their debug monitors, in order to
increase the size of their installed user base.
As shipped, the Arcom board includes a free debug monitor in
Flash memory. Together with host software provided by Arcom, this debug monitor
can be used to download programs directly into target RAM and execute them. To
do this, you can use the tload utility. Simply connect the SourceVIEW
serial communications adapter to the target and host as instructed in the "SourceVIEW
for Target188EB User's Manual" and issue the following command on the host PC:
tload -g blink.exe
SourceView Target Loader v1.4
Copyright (c) Arcom Control Systems Ltd 1994
Opening  'blink.exe'... download size   750H bytes (2K)
Checking COM1 (press ESC key to exit)...
Remote ident: TDR188EB version 1.02
Download successful
Sending 'GO' command to target system
The -g option tells the debug monitor to start
executing the program as soon as the download is complete. So, this is the RAM
equivalent of execution directly out of ROM. In this case, though, we want to
start with the relocatable program. The tload utility will automatically
locate the program for us, at the first available location in RAM.
For remote debugging purposes, Arcom's debug monitor can be
used with Borland's Turbo Debugger as the frontend. Turbo Debugger can then be
used to step through your C/C++ and assembly language programs, set breakpoints
in them, and monitor variables, registers, and the stack as they execute.[1]
Here's the command you would use to start a debugging session
for the Blinking LED program:
tdr blink.exe
tver    -3.1
Target Debugger Version Changer v1.2
Copyright (c) Arcom Control Systems Ltd 1994
Checking COM1 (press ESC key to exit)...
Remote ident: TDR188EB version 1.02
TDR88 set for TD version 3.1

td -rp1 -rs3 blink.exe
Turbo Debugger Version 3.1 Copyright (c) 1988,92 Borland International
Waiting for handshake from remote driver (Ctrl-Break to quit)
The tdr command is actually a batch file that invokes
two other commands. The first tells the on-board debug monitor which version of
Turbo Debugger you will be using, and the second actually invokes it. Both of
these commands need to be issued each time you want to start a remote debugging
session with the Arcom board. The tdr.bat batch file exists solely to
combine them into a single command line. Again we use the relocatable version of
the program because we will be downloading the program into RAM and executing it
from there.
The debugger startup options -rp1 and -rs3
establish the parameters for the communications link to the debug monitor.
-rp1 means "remote-port=1" (COM1) and -rs3 means "remote-speed=3"
(38,400 baud). These are the parameters required to communicate with Arcom's
debug monitor. After establishing a connection to the debug monitor, Turbo
Debugger should start running. If it does not, there might be a problem with the
serial link. Compare your setup of the link to the one in the SourceVIEW user's
manual.
Once you're in Turbo Debugger, you will see a dialog box that
says: "Program out of date on remote, send over link?" When you select "Yes,"
the contents of the file blink.exe will be downloaded to the target RAM.
The debugger will then set an initial breakpoint at main and instruct the
debug monitor to execute the program until that point is reached. So the next
thing you should see is the C source code for main, with a cursor
indicating that the embedded processor's instruction pointer is at the entry
point to that routine.
Using normal Turbo Debugger commands, you can step through
the program, set breakpoints, monitor the values stored in variables and
registers, and do all of the other things debuggers allow. Or you can simply
press the F9 key to immediately execute the rest of the program. If you
do this, you should then see the green LED on the front of the board start
blinking. When you are satisfied that the program and the debugger are both
working properly, press the reset switch attached to the Arcom board. This will
cause the embedded processor to be reset, the LED to stop blinking, and Turbo
Debugger to again respond to your commands.
4.3 Emulators
Remote debuggers are helpful for monitoring and controlling
the state of embedded software, but only an in-circuit emulator (ICE) allows you
to examine the state of the processor on which that program is running. In fact,
an ICE actually takes the place of—or emulates—the processor on your target
board. It is itself an embedded system, with its own copy of the target
processor, RAM, ROM, and its own embedded software. As a result, in-circuit
emulators are usually pretty expensive—often more expensive than the target
hardware. But they are a powerful tool, and in a tight debugging spot nothing
else will help you get the job done better.
Like a debug monitor, an emulator uses a remote debugger for
its human interface. In some cases, it is even possible to use the same debugger
frontend for both. But because the emulator has its own copy of the target
processor it is possible to monitor and control the state of the processor in
real time. This allows the emulator to support such powerful debugging features
as hardware breakpoints and real-time tracing, in addition to the features
provided by any debug monitor.
With a debug monitor, you can set breakpoints in your
program. However, these software breakpoints are restricted to instruction
fetches—the equivalent of the command "stop execution if this instruction is
about to be fetched." Emulators, by contrast, also support hardware breakpoints.
Hardware breakpoints allow you to stop execution in response to a wide variety
of events. These events include not only instruction fetches, but also memory
and I/O reads and writes, and interrupts. For example, you might set a hardware
breakpoint on the event "variable foo contains 15 and register AX
becomes 0."
Another useful feature of an in-circuit emulator is real-time
tracing. Typically, an emulator incorporates a large block of special-purpose
RAM that is dedicated to storing information about each of the processor cycles
that are executed. This feature allows you to see in exactly what order things
happened, so it can help you answer questions, such as, did the timer interrupt
occur before or after the variable bar became 94? In addition, it is
usually possible to either restrict the information that is stored or
post-process the data prior to viewing it in order to cut down on the amount of
trace data to be examined.
4.3.1 ROM Emulators
One other type of emulator is worth mentioning at this point.
A ROM emulator is a device that emulates a read-only memory device. Like an ICE,
it is an embedded system that connects to the target and communicates with the
host. However, this time the target connection is via a ROM socket. To the
embedded processor, it looks like any other read-only memory device. But to the
remote debugger, it looks like a debug monitor.
ROM emulators have several advantages over debug monitors.
First, no one has to port the debug monitor code to your particular target
hardware. Second, the ROM emulator supplies its own serial or network connection
to the host, so it is not necessary to use the target's own, usually limited,
resources. And finally, the ROM emulator is a true replacement for the original
ROM, so none of the target's memory is used up by the debug monitor code.
4.4 Simulators and Other Tools
Of course, many other debugging tools are available to you,
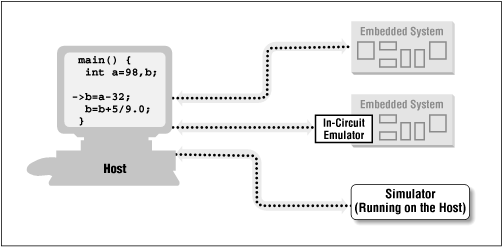
including simulators, logic analyzers, and oscilloscopes. A simulator is a
completely host-based program that simulates the functionality and instruction
set of the target processor. The human interface is usually the same as or
similar to that of the remote debugger. In fact, it might be possible to use one
debugger frontend for the simulator backend as well, as shown in
Figure 4-2. Although
simulators have many disadvantages, they are quite valuable in the earlier
stages of a project when there is not yet any actual hardware for the
programmers to experiment with.

 |
Debugging Tip #2
Debugging Tip #2: If you ever encounter a situation
in which the target processor is behaving differently from how you think
it should from reading the data book, try running the same software in a
simulator. If your program works fine there, then you know it's a
hardware problem of some sort. But if the simulator exhibits the same
weirdness as the actual chip, you'll know you've been misinterpreting
the processor documentation all along. |
|
By far, the biggest disadvantage of a simulator is that it
only simulates the processor. And embedded systems frequently contain one or
more other important peripherals. Interaction with these devices can sometimes
be imitated with simulator scripts or other workarounds, but such workarounds
are often more trouble to create than the simulation is valuable. So you
probably won't do too much with the simulator once you have the actual embedded
hardware available to you.
Once you have access to your target hardware—and especially
during the hardware debugging—logic analyzers and oscilloscopes can be
indispensable debugging tools. They are most useful for debugging the
interactions between the processor and other chips on the board. Because they
can only view signals that lie outside the processor, however, they cannot
control the flow of execution of your software like a debugger or an emulator
can. This makes these tools significantly less useful by themselves. But coupled
with a software debugging tool like a remote debugger or an emulator, they can
be extremely valuable.
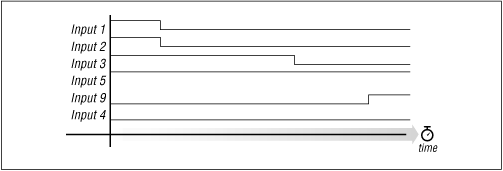
A logic analyzer is a piece of laboratory equipment that is
designed specifically for troubleshooting digital hardware. It can have dozens
or even hundreds of inputs, each capable of detecting only one thing: whether
the electrical signal it is attached to is currently at logic level 1 or 0. Any
subset of the inputs that you select can be displayed against a timeline as
illustrated in Figure 4-3.
Most logic analyzers will also let you begin capturing data, or "trigger," on a
particular pattern. For example, you might make this request: "Display the
values of input signals 1 through 10, but don't start recording what happens
until inputs 2 and 5 are both zero at the same time."

 |
Debugging Tip #3
Debugging Tip #3: Occasionally it is desirable to
coordinate your observation of some set of electrical signals on the
target with the embedded software that is running there. For example,
you might want to observe the bus interaction between the processor and
one of the peripherals attached to it. A handy trick is to add an output
statement to the software just prior to the start of the interaction
you're interested in. This output statement should cause a unique logic
pattern to appear on one or more processor pins. For example, you might
cause a spare I/O pin to change from a zero to a one. The logic analyzer
can then be set up to trigger on the occurrence of that event and
capture everything that follows. |
|
An oscilloscope is another piece of laboratory equipment for
hardware debugging. But this one is used to examine any electrical signal,
analog or digital, on any piece of hardware. Oscilloscopes are sometimes useful
for quickly observing the voltage on a particular pin or, in the absence of a
logic analyzer, for something slightly more complex. However, the number of
inputs is much smaller (there are usually about four) and advanced triggering
logic is not often available. As a result, it'll be useful to you only rarely as
a software debugging tool.
Most of the debugging tools described in this chapter will be
used at some point or another in every embedded project. Oscilloscopes and logic
analyzers are most often used to debug hardware problems — simulators during
early stages of the software development, and debug monitors and emulators
during the actual software debugging. To be most effective, you should
understand what each tool is for and when and where to apply it for the greatest
impact.

