|
|
|
3.2 Controlling ExecutionFor the debugger to do its job well, it must make as few changes as possible to the operation of the program, so simply attaching Visual Studio .NET's debugger does not have much immediate effect. In order to examine a program's state and behavior, you must suspend its execution, so you will need to give VS.NET the criteria under which it should freeze the application and show you what is going on. You can control program execution in three ways with the debugger. Breakpoints enable you to bring the program to a halt on selected lines of code. You can configure the debugger to suspend execution when particular error conditions occur. And once the program has been brought to a halt, you can exercise fine control by single-stepping through the code. 3.2.1 BreakpointsAs
you would expect, Visual Studio .NET allows you to set
breakpointsrequests to suspend the program when it reaches
certain lines of code. You can set a breakpoint by placing the cursor
on the line at which you want execution to stop and pressing F9. F9
will toggle the breakpointif the line already has a breakpoint
set, F9 will remove it. (You can also toggle breakpoints by clicking
in the gray column at the left of the editor.) Visual Studio .NET
indicates that a breakpoint has been set by placing a red circle to
the left of the line, as Figure 3-6 shows. It can
also optionally color the line's
backgroundyou can configure this with the Options dialog. (Use
Tools Figure 3-6. A breakpoint
Sometimes, specifying the line at which to stop is not enoughit is not unusual to need to stop at a line that is executed many thousands of times but that you want to debug only under certain circumstances. In this case, you will need to be a little more selective. Instead of using F9 to set a breakpoint, you can use Ctrl-B, which will display the window shown in Figure 3-7. Figure 3-7. Setting a selective breakpoint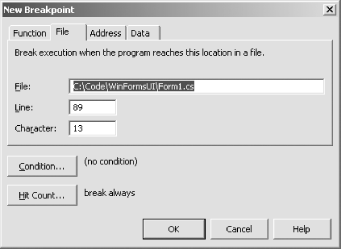 As you would expect, the dialog indicates the location of the breakpoint. The File tab shown here allows the location to be specified as a particular line in a file. (Breakpoints set using F9 work this way.) The Function tab allows you to set a breakpoint on a function by name. Figure 3-8 shows how to use this to trap all calls to a particular .NET system API. (This technique relies on having symbolic information for the function being trapped. This means that it doesn't work on system APIs in unmanaged applications unless you have installed the debug symbolsto trap such calls without system debug symbols installed, you will need to use the Address tab.)
Figure 3-8. Setting a breakpoint by function name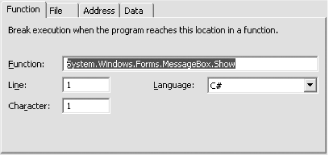 The third tab, Address, allows you to set a breakpoint based on the address of a specific instruction. This is available only with Native Win32 debuggingwith managed code (CLR programs), JIT compilation means that methods can be relocated dynamically, which makes address-based breakpoints useless. (The fields on this tab will be grayed out when working with .NET applications.) The fourth tab, Data, lets you specify location-independent breakpoints that fire only when certain data items are accessed. Data breakpoints are also available only with native debugging. Regardless of which tab you use to specify a breakpoint's location, the bottom half of the dialog will always show the same two buttons: Condition... and Hit Count... These allow you to narrow down the conditions under which the breakpoint will suspend the program. The Hit Count... button displays the dialog shown in Figure 3-9. The drop-down listbox provides four options. Break Always, the default, disables hit counting. "Break when hit count is equal to" causes the breakpoint to be ignored except when it is hit for the Nth time, with N the number specified in the text box. This can be particularly useful when tracking down memory leaks in C++ applicationssee the sidebar. You can also specify "Break when the hit count is greater than or equal to," which is useful in situations in which code operates correctly at first but malfunctions after several executions. Finally, you can specify that the breakpoint should "Break when the hit count is a multiple of" the specified figure, which can be useful if you only want to examine occasional calls to suspect code. The Reset Hit Count button lets you reset Visual Studio .NET's record of the number of times that this breakpoint has been hit so far. Figure 3-9. Specifying a hit count for a breakpoint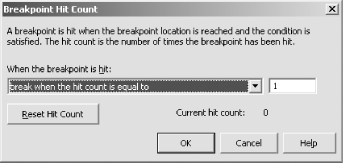
The Condition... button of the Breakpoint Properties dialog in Figure 3-7 provides another way of being selective about when the breakpoint will halt the program. If you click this button, the dialog shown in Figure 3-10 will appear. Figure 3-10. Setting a conditional breakpoint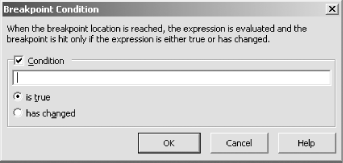 This dialog allows you to specify an expression that will be evaluated when the breakpoint is hit. (It will be evaluated at the scope of the breakpoint, so you may use local variables and method parameters in the expression. You can even call methods in the expression.) You can use the expression in two ways. You can choose to halt execution only if the expression is true. Alternatively, you can halt only if the expression is different from what it was last time the breakpoint was hit. Choosing to halt when an expression is true can be very useful when particular function may be called extremely frequently but you want to debug only a small subset of the calls. Consider some code in a Windows application that is responsible for repainting the window. Redraw code is often particularly awkward to debug with normal breakpoints because the act of hitting a breakpoint will bring the debugger to the front. This obscures the window of the application being debugged, so when you let the program continue, its redraw code will run again, at which point it will, of course, hit the breakpoint again. While this issue can often be solved by using a hit count to stop in the debugger only every other redraw, the fact that repaint code is often called tens of times a second makes them a frequent candidate for a more selective breakpoint. For example, suppose you notice that your window's appearance is wrong whenever the window is square, but correct otherwise. (Certain drawing algorithms have an edge case for perfectly square drawing areas that is easy to get wrong, so this is a fairly common scenario.) Conditional breakpoints can make it easy to catch the one case you are interested in and single-step through that. You can just put a breakpoint on the first line of the redraw handler and set an appropriate condition. For example, in a Windows Forms application, you could use this expression: DisplayRectangle.Width==DisplayRectangle.Height. In order to use a conditional breakpoint, the inputs you require for the expression must be in scope. So for an MFC application you would be able to use this trick only if the window width and height had already been retrievedunlike Windows Forms, MFC does not make these values available directly through class properties. Figure 3-11 shows an example program in which the width and height have been read into local variables, and a suitable conditional breakpoint has been set. Figure 3-11. Conditional redraw breakpoint in an MFC application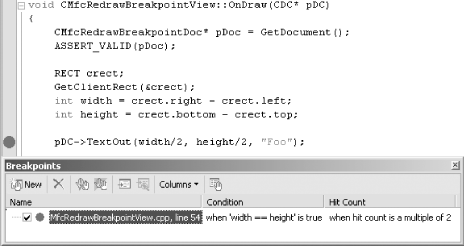
3.2.1.1 Data breakpointsThe New Breakpoint window shown in Figure 3-7 has a fourth tab, Data, which allows you to set a kind of breakpoint that is different from all the others. Data breakpoints are not associated with any particular line of code. With a data breakpoint, you simply specify the name of a variable, and the debugger will halt if that variable changes, regardless of which line of code made the change. This can be very useful for tracking down bugs when a value has changed but you do not know when or why the change occurred.
Figure 3-12 shows the tab for setting a data breakpoint. The variable name must be a global variable. If it is a pointer variable and points to an array, you can use the Items field to specify the number of array elements that the debugger will monitor. The Context field allows you to specify the lexical scope in which the variable name should be evaluatedthis is useful when the expression is otherwise ambiguous. This field takes strings of the form {[function],[source],[module]} location. The function is the name of a method. Since function names are not necessarily globally unique, source specifies the source file in which the function was defined. When debugging across multiple modules (e.g., in a program that uses several DLLs), even source file names may not be unique, so you can specify which particular module you mean with module. Finally, location specifies the exact positionthis is specified as a line number. Figure 3-12. A data breakpoint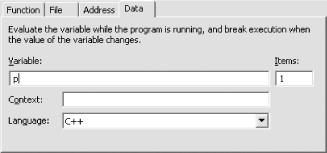 The various parts of the context string are all optionalyou need supply only as many as are required to be unambiguous. For example, to specify that the expression should be evaluated with respect to line 123 of the Hello.cpp source file, use the string {,Hello.cpp,} @123. Because no function was provided, location was relative to the top of the file. However, if you supply a function, location is not required.
3.2.1.2 The Breakpoints windowYou can review, modify, and remove all
of the breakpoints currently in place for your project with the
Breakpoints window. You can open the window using Debug
As Figure 3-13 shows, the Breakpoints window lists all of the breakpoints. You can choose which information will be displayed about each breakpointthe Columns button on the toolbar lets you select any aspect of a breakpoint. By default, the window will show each breakpoint's location and whether it has condition or hit count requirements specified, and the Hit Count column also indicates how many times the breakpoint has been hit so far in the current debugging session. You can modify the breakpoint by selecting it and choosing Properties from the context menuthis will open the Breakpoint Properties window, which is essentially identical to the New Breakpoint window (except that it doesn't let you change a location-based breakpoint to a data breakpoint or vice versa). Figure 3-13. The Breakpoints window The tick box next to the breakpoint indicates that the breakpoint is enabled. If you uncheck this, the breakpoint will be disabled, but not forgotten. (You can also toggle this setting in the editor window by moving the cursor to the relevant line and pressing Ctrl-F9.) This is useful if you want to prevent a breakpoint from operating temporarily but don't want to have to recreate the breakpoint again later. (This is particularly helpful for complex breakpoints such as those with conditions or data breakpoints.) You can also enable and disable breakpoints using the context menu in the source window.
The toolbar at the top of the window provides the ability to create and delete breakpoints, to enable and disable them, to examine the code on which they are set, and to display their properties window. (All of these facilities are also available from the context menu.) 3.2.2 Halting on ErrorsBreakpoints are very useful when you know exactly which part of your program you wish to examine, but in practice, debugging sessions often start when an unexpected error occurs. Just-in-time debugging always works this waywhen you attach the debugger just-in-time, it will halt the program and attempt to show you where the error occurred. But you do not need to rely on just-in-time attachment for this behaviorprograms started from within the debugger can be halted automatically when an unhandled error occurs. Visual Studio .NET can identify many different sources of errors.
There are four general
categories: C++
exceptions, CLR exceptions, CLR runtime checks, and Win32 exceptions.
These categories are subdivided into specific exceptions. You can
configure how VS.NET handles these error types with the Exceptions
dialog, which is displayed using Debug Figure 3-14. Configuring exception handling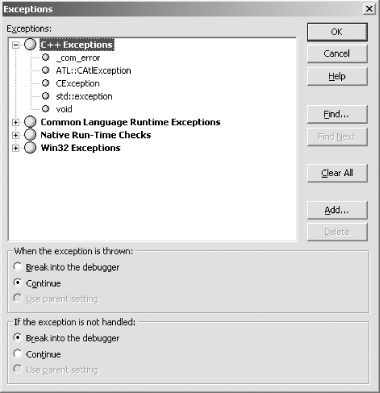 For each error type, Visual Studio .NET allows two error-handling behaviors to be specified: unanticipated errors can be treated differently from those the application is able to handle itself. Unhandled exceptions will use the setting in the "If the exception is not handled" group box. Exceptions that the application handles itself will use the setting in the "When the exception is thrown" group box. The gray circles in Figure 3-14 indicate that the debugger will suspend the code only when an unhandled error occurs. This is the default for all categories. If you change the category's setting, the members of that category will inherit that setting unless they have been explicitly configured to override it. (The default for most category members is Use Parent Setting.) Figure 3-15 shows the effect of changing the C++ Exceptions category settings. The X in a red circle indicates that the error will always cause the debugger to break, regardless of whether the program handles the error. Notice how all of the entries inside the C++ Exceptions category have changed to a red crossthey have all inherited their parents' settings. Figure 3-15. Exception setting inheritance The Exceptions dialog indicates that an entry will inherit its parent's settings by drawing a smaller iconall of the items in the C++ Exceptions category have small circles by them. If you set an item's behavior explicitly, making it ignore the parent setting, you will see a full-sized icon. Figure 3-16 shows how this looksVisual Studio .NET's default configuration has two Win32 exceptions that override their category's default, breaking into the debugger regardless of whether the exceptions are handled by the application. These are the Ctrl-C and Ctrl-Break exceptions. Figure 3-16. Overriding parent behavior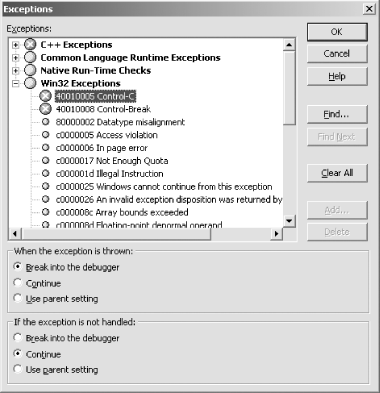
The Exceptions window does not show every possible exception, it simply lists some of the more common ones. If an unlisted exception occurs, it will simply use the category defaults. If this is not what you require, you can use the Add... button to add an entry for the particular exception you wish to configure. Make sure that you select the appropriate category in the tree view before clicking Add.... (For example, don't try to add settings for a .NET exception when the Win32 Exceptions item is selected.) Unless you are debugging your error-handling code, you will not normally need to change the default settingsthey will cause Visual Studio .NET to suspend your code only when there is an unhandled error. This is usually the most helpful behavior. When an unhandled error does occur, you will see the dialog shown in Figure 3-17. This tells you about the error and gives you the option of halting the code in the debugger or continuing with execution (the Break and Continue buttons, respectively). Figure 3-17. An unhandled exception If you select Continue, the application's normal unhandled error management code will run. This will allow execution to continue instead of halting in the debugger. This can be useful if you have written your own application-level unhandled exception handler and wish to debug it.
Be aware that when configuring Visual Studio .NET to halt when an error occurs, you have no guarantee that there will be source code available for the location at which execution halts. If VS.NET cannot find the source code, you will be presented with disassembly. However, you will normally be able to find some of your code in the Stack Trace window, which is described later. 3.2.3 Single-SteppingRegardless of which of the many different ways of halting code in the debugger you choose, you will end up with Visual Studio .NET showing you where the program has been stopped. It indicates the exact line with a yellow arrow in the gray margin at the left of the source code window, and it also highlights the source code in yellow, as Figure 3-18 shows. (The arrow will be drawn over the red circle if the line at which the code stopped has a breakpoint set.) Figure 3-18. The current line in the debuggerWhen execution is suspended like this, there are various things you
can do. You can examine the value of any program data that is in
scope, as described later. You can terminate the program with Debug
The single-stepping shortcut keys are probably the ones that you will
use the most, so although you can use Debug
In versions of Visual Studio prior to .NET, Step Into suffered from ambiguity in the face of multiple method calls. Consider the following code: printf("Name: %s %s", GetTitle( ), GetName( ));
This one line involves three functions: printf, GetTitle, and GetName. Pressing F11 will step into whichever executes first. (The C++ spec doesn't actually dictate the precise order in which the calls will occur in this particular example, beyond requiring printf to be called last. With Microsoft's C++ compiler, it turns out to call GetName first.) When that returns, you can press F11 again to call the second and so on. If you care about only one of the methods, it can be tedious to step through the rest. And although you can always drop down into disassembly mode and locate the call you want, that is hardly an elegant solution. Fortunately, Visual Studio .NET provides a better solution for unmanaged (non-.NET) Win32 C++ applications. (Other languages don't get this feature, sadly.) If execution is halted at a line with multiple method calls, the context menu will have a Step Into Specific menu item. As Figure 3-19 shows, this item has a submenu with each of the functions shown. If you select an item from this list, the debugger will step into that one.
Figure 3-19. Stepping into a specific function Unfortunately, C# and Visual Basic .NET are not blessed with this feature. However, the debugger does provide a feature that can mitigate this shortcoming. Any method that has been marked with the System.Diagnostics.DebuggerStepThrough attribute will not be stepped into when F11 is pressedit will be executed without single-stepping. This attribute is particularly appropriate for simple property accessors. The accessor in Example 3-2 is so straightforward that it is unlikely to be informative to step into it, so the attribute will make it effectively invisible to Step Into (F11). (The code can still be stepped through if it turns out to be necessary by setting a breakpoint inside the accessor, so there is no harm in using this attribute on such methods.) Example 3-2. Disabling Step Into for trivial methodsprivate int _index;
private int CurrentIndex
{
[System.Diagnostics.DebuggerStepThrough]
get { return _index; }
}
3.2.3.1 Stepping through multiple linesSometimes, you will need to single-step through some code that has regions that are tedious to work through one line at a time. A common example is code with a long, uninteresting loop. It is relatively straightforward to avoid having to single-step through such a section by placing a breakpoint at the end and letting the code run. But there is a slightly quicker way. You can simply move the cursor past the dull section, to the first line at which you would like to resume single-stepping, and press Ctrl-F10. (Alternatively, you can select Run to Cursor from the context menu, which has the same effect; for some reason this option is not available from the main menu.) There is another common situation in which you will wish to step
through several lines in one go. Sometimes when you step into (F11) a
method, it will become apparent that the method is not interesting
enough to warrant stepping through all of it. You could use Run to
Cursor (Ctrl-F10) to move back to the parent method, but it is easier
to use Debug 3.2.3.2 Changing the current point of executionOccasionally you will want to disrupt the natural flow of execution. You can manually adjust the current execution location of the code by using the context menu's Set Next Statement item. You can only move within the currently executing method, but you can move both forward and backward. (So you can either skip code or rerun code.) Adjusting the execution location can be powerful technique. It can allow you to go back and watch a piece of code's execution a second time in case you missed some aspect of its behavior. Used in conjunction with the ability to modify the program's variables (see Section 3.3.1, later in this chapter) it can also provide a way of experimenting with the code's behavior in situ. However, you should avoid using this feature if possible, because it may have unintended consequences. Compilers do not generate code that is guaranteed to work when you leap from one location to another, so anomalous behavior may occur. Variables may not be initialized correctly, and you may even see more insidious problems like stack corruption. So you should always prefer to restart a program and recompile it if necessary. However, if you are tracking down a problem that is very hard to reproduce, this feature can be extremely useful, because it allows you a degree of latitude for experimentation on the occasions when the behavior you are looking for does manifest itself. 3.2.3.3 Edit and continueEdit and continue is a feature that allows code to be edited during a debugging session. The only language that supports this feature in the first release of Visual Studio .NET is C++. This is a little surprising because Visual Basic was the first language to get edit and continue. Unfortunately, certain features of the .NET runtime make it extremely hard to implement edit and continue, so now that Visual Basic is a .NET language, only classic unmanaged Win32 C++ applications get this feature. However, we hope for its return in a future version of Visual Basic .NET. Edit and continue can be a great time-saver, because it enables you to fix errors without having to stop your debug session, rebuild, and restart. This can be particularly helpful in scenarios in which a bug is tricky to reproduce. If you have spent half a day getting to the point to see the program fail, it can be very useful to try out a fix in situ without having to rebuild and then start again from scratch. Edit and continue can also sometimes be useful for experimenting with a program's behavior. In combination with the ability to change the next line to be executed and to modify program variables, the ability to change the code makes it very easy to try out several snippets of code in quick succession to see how they behave. |
|
|
|