|
|
|
3.4 Debugging and Project SettingsThe Visual Studio .NET debugger relies on having detailed information about your program. To be able to provide source-level debugging, it needs to know how compiled code relates to source code. In order to be able to evaluate expressions, it needs to know about the variables and types in use in your program. And for .NET programs, it needs the CLR's cooperation to be able to display the values of local variables and parameters. The information required for debugging does not come for free. The symbols and line number information take up space. Making local variables and parameters available to the debugger places extra constraints on the compiler, reducing performance. Furthermore, this information makes it much easier to reverse engineer code. For all of these reasons, you will probably not want to ship debug versions of your programs.
When you create a new project, Visual Studio .NET will create at least two different configurations for that project, enabling you to build debug and release versions of the code. Release builds usually have no symbols beyond those required by the target technology. (For native Win32 applications, the only symbols will be those needed for DLL import and export tables. For .NET applications, full type information, but not enough information to perform source-level debugging, will be present.) Release builds are also normally compiled with full optimizations enabled. (And in the case of .NET applications, where most of the compilation process is done by the CLR, the binary will be marked as nondebug, enabling the CLR to perform full optimizations.) Optimizations are disabled in debug builds because they tend to interfere with the debugger's ability to display the program's state. Debug builds will have the DEBUG symbol defined. Some programs use this to make sure that certain code appears only in debug build. For example, the debug trace output mentioned earlier uses this. Note that in .NET projects a TRACE symbol will also be defined, both in debug and release buildsthis controls the use of the Trace class. So, you could add another build configuration that omits all trace output, whether it came from the Debug or the Trace class, by defining neither the DEBUG nor the TRACE symbol. Figure 3-27 and Figure 3-28 show the parts of the project property pages where optimization and trace settings are controlled. (You can find these by right-clicking on the project in the Solution Explorer and selecting Properties.) Figure 3-27. Debug project settings Figure 3-28. Release project settings 3.4.1 Release-Only BugsSome bugs occur only in release mode. This is usually because enabling full compiler optimizations can allow bugs, which would remain silent in debug mode, to manifest. Mostly this is due to problems such as reading uninitialized variables. Unfortunately, such faults can be hard to diagnose because, as soon as you try to debug them, they disappear.
Fortunately, you can attach a debugger to a release build. However, you must be careful how you do so if you want the results to be useful. By default, you will get nothing but assembly language in the debugger when you do this, but it is possible to get a little more information. Note that, as Figure 3-27 shows, a Debug project will be set to generate unoptimized code. You can change the Debug project's Optimize Code setting to true and still get most of the debugging symbols created. (The generation of debugging information is controlled by a separate compiler flag further down on the same property page under the Outputs category, as Figure 3-29 shows.) Figure 3-29. Enabling debug symbol generationIf you build with a project configuration that has both debugging information and optimization enabled, you will still be able to use most of the debugger's normal functionality. Certain variables may not be accessible at runtime, and you may even see strange behavior when single-steppingthe compiler sometimes reorders code execution as part of the optimization process. But if this lets you observe a bug in action that does not manifest when optimizations are disabled, then these inconveniences are worthwhile. (Of course, you may still find that the bug occurs only when the debugger is not attached, in which case you must resort to more old-fashioned techniques.)
3.4.2 Choosing Debugging ModesWhen using just-in-time debugging to
attach to a process, you were presented with a list of different
program types to debug, as shown in Figure 3-2. You
will not be shown this list if you simply launch your program from
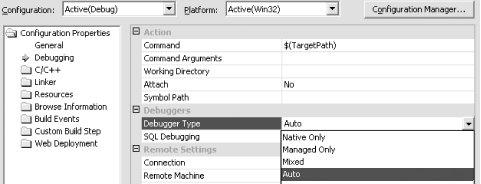
within Visual Studio .NET using Debug Fortunately, you have the same flexibility when launching a program from within Visual Studio .NET as you do when attaching to an existing one. It is simply that the program type decision is determined by the project's settings rather than by opening a dialog every time you debug. Figure 3-30 shows the relevant section of the project properties dialog for .NET projects. Figure 3-30. Managed project debug settings The Unmanaged Debugging, SQL Debugging, and ASP Debugging settings are equivalent, respectively, to the Native, T-SQL, and Script settings of the Attach to Process dialog shown in Figure 3-2. The Attach to Process dialog also has a Common Language Runtime option. There is no direct equivalent in Figure 3-30Visual Studio .NET simply knows that this particular project is for the .NET platform and will always enable CLR debugging. For native Win32 projects, the project settings look a little different, as Figure 3-31 shows. Figure 3-31. Unmanaged project debug settings For unmanaged projects, you can select whether you want CLR (Managed Only), Native, or both. (Auto will examine the .exe file and choose CLR or Native according to its contents.) The SQL Debugging option enables or disables T-SQL debugging. (Remember that native debugging and script debugging are mutually exclusive, so you are not presented with the option of script debugging for a native application.) |
|
|
|