 |  |

While we can't cover all the features of NNM in this appendix, we'll discuss each of the following:
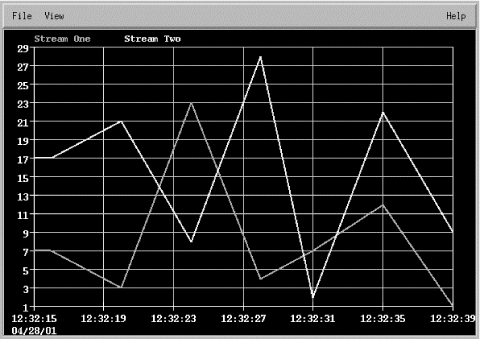
Here's a table we created by hand, copying the format of a standard xnmgraph datafile. The data points are organized into streams. A stream is a set of data that will be plotted as a single curve on the graph. All the streams in the file will be combined into a single graph with multiple curves. The StartTime is ignored. The StopTime provides the value for the X (horizontal) axis and the Value provides the value for the Y (vertical) axis:
The following xnmgraph command displays our datafile. Notice that we use stream numbers, preceded by minus signs, instead of object IDs. The minus sign indicates that the stream can take on negative values. If the stream number is preceded by a + or = sign, xnmgraph will take the absolute value of all negative numbers in the datafile.# /tmp/data1 # # Stream Number StartTime StopTime Value # ------------- --------- ------------------- ----- # # Start of Stream 1 # 1 0 04.28.2001-12:32:16 7 1 0 04.28.2001-12:32:20 3 1 0 04.28.2001-12:32:24 23 1 0 04.28.2001-12:32:28 4 1 0 04.28.2001-12:32:31 7 1 0 04.28.2001-12:32:35 12 1 0 04.28.2001-12:32:39 1 # # Start of Stream 2 # 2 0 04.28.2001-12:32:16 17 2 0 04.28.2001-12:32:20 21 2 0 04.28.2001-12:32:24 8 2 0 04.28.2001-12:32:28 28 2 0 04.28.2001-12:32:31 2 2 0 04.28.2001-12:32:35 22 2 0 04.28.2001-12:32:39 9
Figure B-1 shows the result of this command. If your graph looks squished, right-click on it and then left-click on "Show All." An option under the View menu lets you generate a black-and-white graph, which is often more effective if you have only a small number of streams.cat /tmp/data1 | xnmgraph -mib "-1:Stream One:::::::,-2:Stream Two:::::::"

Imagine taking 10,000 lines of this output and trying to figure out the trends (min/avg/max) in any given parameter. It's not easy. But with some help from a Perl script, we can massage this data into an xnmgraph input file. Here is what our Perl script looks like:procs memory page disk faults cpu r b w swap free re mf pi po fr de sr s6 s2 s2 sd in sy cs us sy id 0 4 0 5431056 33672 1 2371 0 8 8 0 0 0 18 18 2 2161 5583 4490 17 14 69 0 2 0 5430912 33576 1 2499 0 20 20 0 0 0 1 1 0 2997 8374 7030 25 18 58 0 2 0 5431296 33824 0 179 4 0 0 0 0 0 0 0 1 2587 3990 6379 18 8 74 0 0 0 5431240 33792 1 2460 4 8 8 0 0 0 1 1 0 2909 7768 7080 25 18 57 0 3 0 5431216 33768 1 2359 0 12 12 0 0 0 2 2 0 1934 5057 3818 18 13 70 0 0 0 5431288 33824 0 136 0 0 0 0 0 0 0 0 1 1842 2190 3803 13 5 82 0 2 0 5431216 32920 2 1189 0 3196 3176 0 0 0 0 0 4 2734 9980 5642 24 11 65 0 4 0 5431032 32352 8 1571 0 3100 3044 0 0 0 2 2 5 2763 7767 5817 22 15 63
#!/usr/local/bin/perl
# Filename: /usr/local/bin/perl_scripts/cputimes

$|++; # Unbuffer the output!

open(VMSTAT,"/bin/vmstat 2 |") || die "Can't Open VMStat";
while($CLINE=<VMSTAT>)
{
    ($null,$r,$b,$w,$swap,$free,$re,$mf,$pi,$po,$fr,$de,$sr,$aa,$dd1,\
$dd2,$f0,$in,$sy,$cs,$us,$sycpu,$id) = split(/\s+/,$CLINE);

    if (($id) && ($id ne "id"))
    {
        $DATE = `date +%m.%d.%y-%H:%M:%S`;
        chomp $DATE;
        print "1 0 $DATE $us \n";
        print "2 0 $DATE $sycpu \n";
        print "3 0 $DATE $id \n";
    }
    sleep 2;
}
The following command generates a graph from the script's output:[root][nms] /> /usr/local/bin/perl_scripts/cputimes 1 0 8.14.99-21:00:22 6 2 0 8.14.99-21:00:22 3 3 0 8.14.99-21:00:22 92 1 0 8.14.99-21:00:24 0 2 0 8.14.99-21:00:24 0 3 0 8.14.99-21:00:24 100 1 0 8.14.99-21:00:26 1 2 0 8.14.99-21:00:26 0 3 0 8.14.99-21:00:26 98 1 0 8.14.99-21:00:28 1 2 0 8.14.99-21:00:28 0 3 0 8.14.99-21:00:28 99
While this graph is based on live data, it's trivial to save data in an appropriate format and write a script that pulls historical data from your logs and plots it with xnmgraph./usr/local/bin/perl_scripts/cputimes | xnmgraph -title "CPU Time" -mib \ "+1:User:::::::,+2:System:::::::,+3:Idle:::::::"

Copyright © 2002 O'Reilly & Associates. All rights reserved.