 |  |

[38]Many devices say they are SNMP-compatible but support only a few MIBs. This makes polling nearly impossible. If you don't have the object(s) to poll there is nothing you can do, unless there are hooks for an extensible agent. Even with extensible agents, unless you know how to program, the Simple in SNMP goes away fast.Each of the external polling engines we will look at uses the same polling methods, although some NMSs implement external polling differently. We'll start with the OpenView xnmgraph program, which can be used to collect and display data graphically. You can even use OpenView to save the data for later retrieval and analysis. We'll include some examples that show how you can collect data and store it automatically and how you can retrieve that data for display. Castle Rock's SNMPc also has an excellent data-collection facility that we will use to collect and graph data.
 Line
Configuration" lets you specify which objects you would like to
display; it can also set multipliers for different items. For
example, to display everything in K, multiply the data by .001. There
is also an option ("View
  Statistics") that shows a
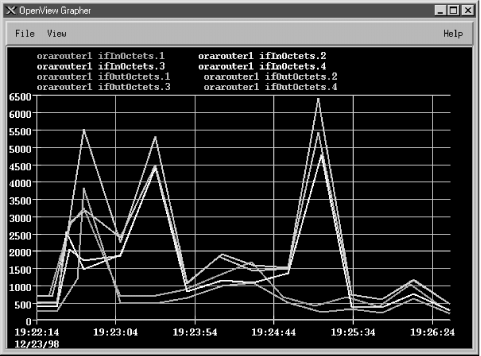
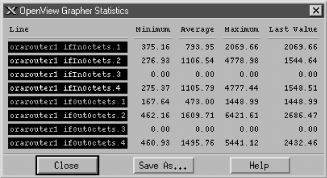
statistical summary of your graph. Figure 9-4 shows
some statistics from the graph in Figure 9-3. While
the statistics menu is up, you can left-click on the graph; the
statistics window will display the values for the specific date and
time to which you are pointing with the mouse.
WARNING: Starting xnmgraph from the command line allows you to start the grapher at a specific polling period and gives you several other options. By default, OpenView polls at 10-second intervals. In most cases this is fine, but if you are polling a multiport router to check if some ports are congested, a 10-second polling interval may be too quick and could cause operational problems. For example, if the CPU is busy answering SNMP queries every 10 seconds, the router might get bogged down and become very slow, especially if the router is responsible for OSPF or other CPU-intensive tasks. You may also see messages from OpenView complaining that another poll has come along while it is still waiting for the previous poll to return. Increasing the polling interval usually gets rid of these messages.Some of NNM's default menus let you use the grapher to poll devices depending on their type. For example, you can select the object type "router" on the NNM and generate a graph that includes all your routers. Whether you start from the command line or from the menu, there are times when you will get a message back that reads "Requesting more lines than number of colors (25). Reducing number of lines." This message means that there aren't enough colors available to display the objects you are trying to graph. The only good ways to avoid this problem are to break up your graphs so that they poll fewer objects or to eliminate object instances you don't want. For example, you probably don't want to graph router interfaces that are down (for whatever reason) and other "dead" objects. We will soon see how you can use a regular expression as one of the arguments to the xnmgraph command to graph only those interfaces that are up and running. Although the graphical interface is very convenient, the command-line interface gives you much more flexibility. The following script displays the graph in Figure 9-3 (i.e., the graph we generated through the browser):
You can run this script with the command:#!/bin/sh # filename: /opt/OV/local/scripts/graphOctets # syntax: graphOctets <hostname> /opt/OV/bin/xnmgraph -c public -mib \ ".iso.org.dod.internet.mgmt.mib-2.interfaces.ifTable.ifEntry.ifInOctets::::::::,\ .iso.org.dod.internet.mgmt.mib-2.interfaces.ifTable.ifEntry.ifOutOctets::::::::" \ $1
The worst part of writing the script is figuring out what command-line options you want -- particularly the long strings of nine colon-separated options. All these options give you the ability to refine what you want to graph, how often you want to poll the objects, and how you want to display the data. (We'll discuss the syntax of these options as we go along, but for the complete story, see the xnmgraph(1) manpage.) In this script, we're graphing the values of two MIB objects, ifInOctets and ifOutOctets. Each OID we want to graph is the first (and in this case, the only) option in the string of colon-separated options. On our network, this command produces eight traces: input and output octets for each of our four interfaces. You can add other OIDs to the graph by adding sets of options, but at some point the graph will become too confusing to be useful. It will take some experimenting to use the xnmgraph command efficiently, but once you learn how to generate useful graphs you'll wonder how you ever got along without it.$ /opt/OV/local/scripts/graphOctets orarouter1
WARNING: Keeping your scripts neat is not only good practice, but also aesthetically pleasing. Using a "\" at the end of a line indicates that the next line is a continuation of the current line. Breaking your lines intelligently makes your scripts more readable. Be warned that the Unix shells do not like extra whitespace after the "\". The only character after each "\" should be one carriage return.Now, let's modify the script to include more reasonable labels -- in particular, we'd like the graph to show which interface is which, rather than just showing the index number. In our modified script, we've used numerical object IDs, mostly for formatting convenience, and we've added a sixth option to the ugly sequence of colon-separated options: .1.3.6.1.2.1.2.2.1.2 (this is the ifDescr, or interface description, object in the interface table). This option says to poll each instance and use the return value of snmpget .1.3.6.1.2.1.2.2.1.2.INSTANCE as the label. This should give us meaningful labels. Here's the new script:
To see what we'll get for labels, here's the result of walking .1.3.6.1.2.1.2.2.1.2:#!/bin/sh # filename: /opt/OV/local/scripts/graphOctets # syntax: graphOctets <hostname> /opt/OV/bin/xnmgraph -c public -title Bits_In_n_Out -mib \ ".1.3.6.1.4.1.9.2.2.1.1.6:::::.1.3.6.1.2.1.2.2.1.2:::,\ .1.3.6.1.4.1.9.2.2.1.1.8:::::.1.3.6.1.2.1.2.2.1.2:::" $1
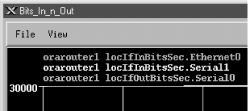
Figure 9-5 shows our new graph. With the addition of this sixth option, the names and labels are much easier to read.$ snmpwalk orarouter1 .1.3.6.1.2.1.2.2.1.2 interfaces.ifTable.ifEntry.ifDescr.1 : DISPLAY STRING- (ascii): Ethernet0 interfaces.ifTable.ifEntry.ifDescr.2 : DISPLAY STRING- (ascii): Serial0 interfaces.ifTable.ifEntry.ifDescr.3 : DISPLAY STRING- (ascii): Serial1
This tells us that only two interfaces are currently up. By looking at ifDescr, we see that the live interfaces are Ethernet0 and Serial0; Serial1 is down. Notice that the type of ifOperStatus is INTEGER, but the return value looks like a string. How is this? RFC 1213 defines string values for each possible return value:$ snmpwalk orarouter1 .1.3.6.1.2.1.2.2.1.8 interfaces.ifTable.ifEntry.ifOperStatus.1 : INTEGER: up interfaces.ifTable.ifEntry.ifOperStatus.2 : INTEGER: up interfaces.ifTable.ifEntry.ifOperStatus.3 : INTEGER: down
ifOperStatus OBJECT-TYPE
    SYNTAX  INTEGER {
                up(1),       -- ready to pass packets
                down(2),
                testing(3)   -- in some test mode
            }
    ACCESS  read-only
    STATUS  mandatory
    DESCRIPTION
        "The current operational state of the interface. The testing(3)
         state indicates that no operational packets can be passed."
::= { ifEntry 8 }if (ifOperStatus == 1) {
pollForMIBData;
graphOctets;
}This command graphs the ifInOctets and ifOutOctets of any interface that has a current operational state equal to 1, or up. It therefore polls and graphs only the ports that are important, saving on network bandwidth and simplifying the graph. Furthermore, we're less likely to run out of colors while making the graph because we won't assign them to useless objects. Note, however, that this selection happens only during the first poll and stays effective throughout the entire life of the graphing process. If the status of any interface changes after the graph has been started, nothing in the graph will change. The only way to discover any changes in interface status is to restart xnmgraph. Finally, let's look at:#!/bin/sh # filename: /opt/OV/local/scripts/graphOctets # syntax: graphOctets <hostname> /opt/OV/bin/xnmgraph -c public \ -title Octets_In_and_Out_For_All_Up_Interfaces \ -mib ".1.3.6.1.2.1.2.2.1.10:::.1.3.6.1.2.1.2.2.1.8:1::::, \ .1.3.6.1.2.1.2.2.1.16:::.1.3.6.1.2.1.2.2.1.8:1::::" $1
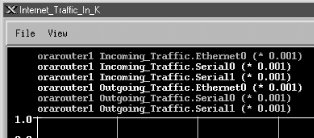
The labels are given by the second and sixth fields in the colon-separated options (the second field provides a textual label to identify the objects we're graphing and the sixth uses the ifDescr field to identify the particular interface); the constant multiplier (.001) is given by the eighth field; and the polling interval (in seconds) is given by the -poll option.#!/bin/sh # filename: /opt/OV/local/scripts/graphOctets # syntax: graphOctets <hostname> /opt/OV/bin/xnmgraph -c public -title Internet_Traffic_In_K -poll 68 -mib \ ".1.3.6.1.4.1.9.2.2.1.1.6:Incoming_Traffic::::.1.3.6.1.2.1.2.2.1.2::.001:,\ .1.3.6.1.4.1.9.2.2.1.1.8:Outgoing_Traffic::::.1.3.6.1.2.1.2.2.1.2::.001:" \ $1
[39]Different vendors have different UPS MIBs. Refer to your particular vendor's MIB to find out which object represents low battery power.Before leaving xnmgraph, we'll take a final look at the nastiest aspect of this program: the sequence of nine colon-separated options. In the examples, we've demonstrated the most useful combinations of options. In more detail, here's the syntax of the graph specification:
The parameters are:object:label:instances:match:expression:instance-label:truncator:multiplier:nodes
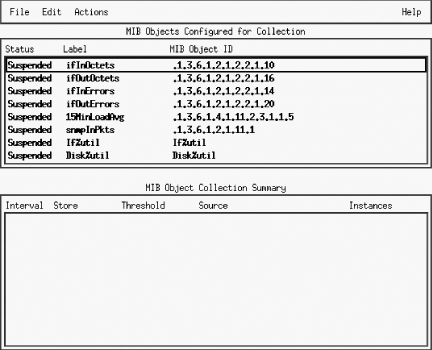
 Add MIB Object." This takes you to a new
screen. At the top, click on "MIB Object"[40] and click down through the tree until you
find the object you would like to poll. To look at the status of our
printer's paper tray, for example, we need to navigate down to
.iso.org.dod.internet.private.enterprises.hp.nm.system.net-peripheral.net-printer.generalDeviceStatus.gdStatusEntry.gdStatusPaperOut
(.1.3.6.1.4.1.11.2.3.9.1.1.2.8).[41] The object's description suggests that this is the
item we want: it reads "This indicates that the peripheral is
out of paper." (If you already know what you're looking
for, you can enter the name or OID directly.) Once there, you can
change the name of the collection to something that is easier to
read. Click "OK" to move forward. This brings you to the
menu shown in Figure 9-8.
[40]You can collect the value of an expression instead of a single MIB object. The topic of expressions is out of the scope of this book but is explained in the mibExpr.conf (4) manpage.
[41]This object is in HP's private MIB, so it won't be available unless you have HP printers and have installed the appropriate MIBs. Note that there is a standard printer MIB, RFC 1759, but HP's MIB has more useful information.
sysObjectID OBJECT-TYPE
    SYNTAX  OBJECT IDENTIFIER
    ACCESS  read-only
    STATUS  mandatory
    DESCRIPTION
        "The vendor's authoritative identification of the network
         management subsystem contained in the entity. This value
         is allocated within the SMI enterprises subtree (1.3.6.1.4.1)
         and provides an easy and unambiguous means for determining
         what kind of box' is being managed. For example, if vendor
         'Flintstones, Inc.' was assigned the subtree 1.3.6.1.4.1.4242,
         it could assign the identifier 1.3.6.1.4.1.4242.1.1 to its
         'Fred Router'."
::= { system 2 } Save"), and you're done.
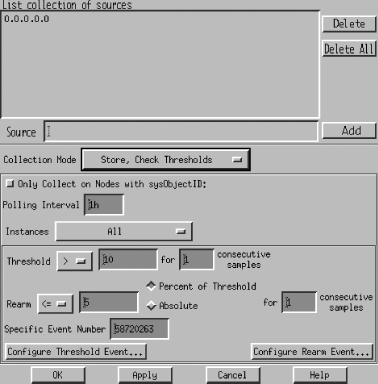
 Add MIB Object." Navigate through the object tree until you get
to locIfInBitsSec; click "OK" to get
back to the screen shown in Figure 9-8. Specify the
IP addresses of the interfaces you want to monitor and set the
collection mode to "Store, Check Thresholds"; this allows
you to retrieve and view the data at a later time. (I typically turn
on the "Store" function so I can verify that the
collector is actually working and view any data that has
accumulated.) Pick a reasonable polling interval -- again, when
you're testing it's reasonable to use a short
interval -- then choose which instances you'd like to poll,
and you're ready to set thresholds.
The "Threshold" field lets you specify the point at which
the value you're monitoring becomes interesting. What
"interesting" means is up to you. In this case,
let's assume that we're monitoring a T1 connection, with
a capacity of 1.544 Mbits/second. Let's say somewhat
arbitrarily that we'll start worrying when the incoming traffic
exceeds 75% of our capacity. So, after multiplying, we set the
threshold to "> 1158000". Of course, network traffic
is fundamentally bursty, so we won't worry about a single
peak -- but if we have two or three consecutive readings that
exceed the threshold, we want to be notified. So let's set
"consecutive samples" to 3: that shields us from getting
unwanted notifications, while providing ample notification if
something goes wrong.
Setting an appropriate
consecutive samples value will make your life much more pleasant,
though picking the right value is something of an art. Another
example is monitoring the /tmp partition of a
Unix system. In this case, you may want to set the threshold to
">= 85", the number of consecutive samples to 2, and
the poll interval to 5m. This will generate an event when the usage
on /tmp exceeds 85% for two consecutive polls.
This choice of settings means that you won't get a false alarm
if a user copies a large file to /tmp and then
deletes the file a few minutes later. If you set consecutive samples
to 1, NNM will generate a Threshold event as soon as it notices that
/tmp is filling up, even if the condition is
only temporary and nothing to be concerned about. It will then
generate a Rearm event after the user deletes the file. Since we are
really only worried about /tmp filling up and
staying full, setting the consecutive threshold to 2 can help reduce
the number of false alarms. This is generally a good starting value
for consecutive samples, unless your polling interval is very high.
The rearm parameters let us specify when everything is back to normal
or is, at the very least, starting to return to normal. This state
must occur before another threshold is met. You can specify either an
absolute value or a percentage. When monitoring the packets arriving
at an interface, you might want to set the rearm threshold to
something like 926,400 bits per second (an absolute value that
happens to be 60% of the total capacity) or 80% of the threshold
(also 60% of capacity). Likewise, if you're generating an alarm
when /tmp exceeds 85% of capacity, you might
want to rearm when the free space returns to 80% of your 85%
threshold (68% of capacity). You can also specify the number of
consecutive samples that need to fall below the rearm point before
NNM will consider the rearm condition met.
The
final option, "Configure Threshold Event," asks what
OpenView events you would like to execute for each state. You can
leave the default event, or you can refer to Chapter 10, "Traps" for more on how to configure events.
The "Threshold" state needs a specific event number that
must reside in the HP enterprise. The default Threshold event is
OV_DataCollectThresh - 58720263. Note that the
Threshold event is always an odd number. The Rearm event is the next
number after the Threshold event: in this case, 58720264. To
configure events other than the default, click on "Configure
Threshold Event" and, when the new menu comes up, add one event
(with an odd number) to the HP section and a second event for the
corresponding Rearm. After making the additions, save and return to
the Collection windows to enter the new number.
When you finish configuring the
data collection, click "OK." This brings you back to the
Data Collection and Thresholds menu. Click "File
  Save" to make your current additions active. On the bottom half
of the "MIB Object Collection Summary" window, click on
your new object and then on "Actions
  Test SNMP."
This brings up a window showing the results of an SNMP test on that
collection. After the test, wait long enough for your polling
interval to have expired once or twice. Then click on the object
collection again, but this time click on "Actions
  Show
Data." This window shows the data that has been gathered so
far. Try blasting data through the interface to see if you can
trigger a Threshold event. If the Threshold events are not occurring,
verify that your threshold and polling intervals are set correctly.
After you've seen a Threshold event occur, watch how the Rearm
event gets executed. When you're finished testing, go back and
set up realistic polling periods, add any additional nodes you would
like to poll, and turn off storing if you don't want to collect
data for trend analysis. Refer to the
$OV_LOG/snmpCol.trace file if you are having any
problems getting your data collection rolling. Your HP OpenView
manual should describe how to use this trace file to troubleshoot
most problems.
Once you have collected some data,
you can use xnmgraph to display it. The
xnmgraph command to use is similar to the ones we
saw earlier; it's an awkward command that you'll want to
save in a script. In the following script, the -browse
option points the grapher at the stored data:
Once the graph has started, no real (live) data will be graphed; the display is limited to the data that has been collected. You can click on "File#!/bin/sh # filename: /opt/OV/local/scripts/graphSavedData # syntax: graphSavedData <hostname> /opt/OV/bin/xnmgraph -c public -title Bits_In_n_Out_For_All_Up_Interfaces \ -browse -mib \ ".1.3.6.1.4.1.9.2.2.1.1.6:::.1.3.6.1.2.1.2.2.1.8:1:.1.3.6.1.2.1.2.2.1.2:::,\ .1.3.6.1.4.1.9.2.2.1.1.8:::.1.3.6.1.2.1.2.2.1.8:1:.1.3.6.1.2.1.2.2.1.2:::" \ $1
 Update
Data" to check for and insert any data that has been gathered
since the start of the graph. Another option is to leave off
-browse, which allows the graph to continue
collecting and displaying the live data along with the collected
data.
Finally, to graph all
the data that has been collected for a specific node, go to NNM and
select the node you would like to investigate. Then select
"Performance
  Graph SNMP Data
  Select Nodes"
from the menus. You will get a graph of all the data that has been
collected for the node you selected. Alternately, select the
"All" option in "Performance
  Graph SNMP
Data." With the number of colors limited to 25, you will
usually find that you can't fit everything into one
graph.
snmpOutPkts OBJECT-TYPE
    SYNTAX  Counter
    ACCESS  read-only
    STATUS  mandatory
    DESCRIPTION
        "The total number of SNMP messages which were passed from
         the SNMP protocol entity to the transport service."
    ::= { snmp 2 }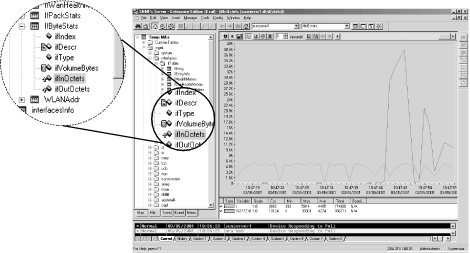
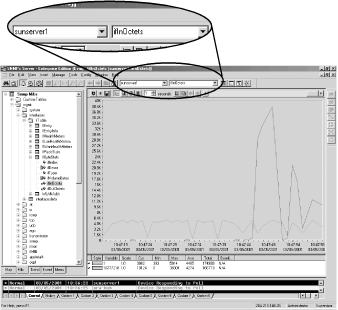
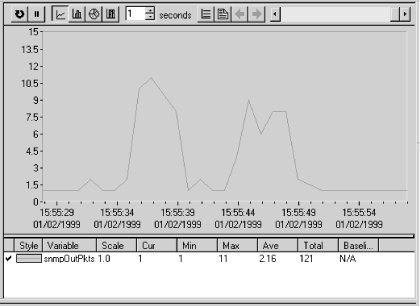
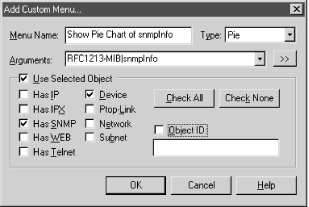
TIP: SNMPc has a nonstandard way of organizing MIB information. To get to the snmpOutPkts object, you need to click down through the following: "Snmp MIBsOnce you have selected the appropriate MIB object, return to the top level of your map by either selecting the house icon or clicking on the Root Subnet tab (at the far left) to select the device you would like to poll. Instead of finding and clicking on the device, you can enter in the device's name by hand. If you have previously polled the device, you can select it from the drop-down box. Figure 9-10 shows what a completed menu bar should look like.mgmt
snmp
snmpInfo." Though this is quicker than the RFC-based organization used by most products, it does get a little confusing, particularly if you work with several products.
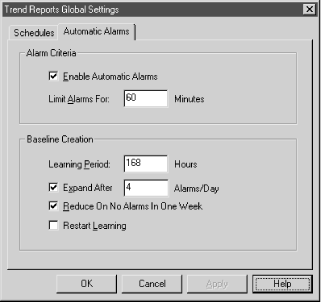
 Trend
Reports" brings up the menu shown in Figure 9-13.

Copyright © 2002 O'Reilly & Associates. All rights reserved.