Book HomeEssential SNMPSearch this book

13.2. Viewing Graphs

Once you've generated some graphs, you will want to look at them to see the results. To make it easier to view the graphs, MRTG comes with an indexmaker script that generates HTML index pages. Here's how to run indexmaker for a typical set of graphs:

[root][linuxserver] ~/mrtg-2.9.10> indexmaker --title "Cisco to Internet" \ 
--filter name=~'cisco' --output /mrtg/images/cisco.html /mrtg/run/mrtg.cfg
This command creates one index page with the five-minute average graph for each target you've specified in your mrtg.cfg file. Keep in mind that the target is the interface from which you're gathering data. If you have four targets for your router, there will be four graphs in the index file, all pointing to the daily, weekly, monthly, and yearly summary graphs for that target. The - -title option tells indexmaker what title to use for the index file. - -filter name=~cisco allows you to select some of the targets in the mrtg.cfg file by using a regular expression: we told indexmaker to find all targets that include the string cisco. The - -output option is the name of the index file. The final argument on the command line is the full path to the configuration file.
Table 13-1 gives a synopsis of these options as well as some other useful options to indexmaker.

Table 13-1. Command-Line Options to indexmaker

Option

Description

--title

Specify a title for the HTML page.

--filter

Specify the regular expression that will be used to find a specific target from the mrtg.cfg file. These matched targets are used to create the HTML report files.

--output

Indicate the full pathname for the HTML file that is to be generated. The default is standard output.

--sort

Sort how the graphs show up on the index page.

--columns

Arrange the graphs on the index page by x columns. The default is 2.

--width

Set the width of the graphs. This is not set by default.

--height

Set the height of the graphs. This is not set by default.

--show

Pick which graph to show on the index page. The default is day. Other options include week, month, year, and none.

To display the entire list of options to indexmaker, run the command without any options. Figure 13-1 shows how the cisco.html file generated by indexmaker looks when it's loaded into a web browser.
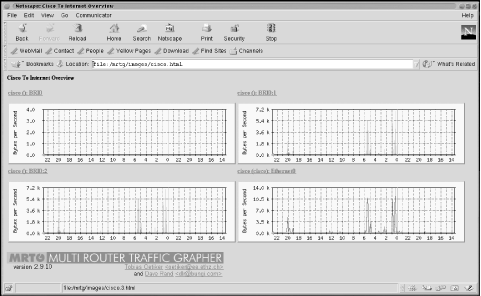
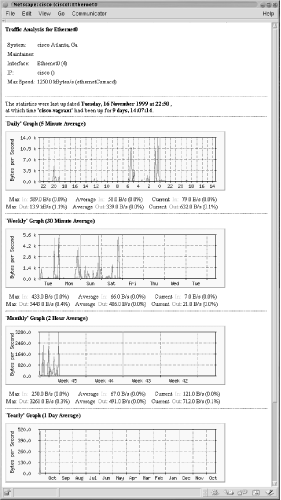
Figure 13-1

Figure 13-1. Cisco graph overview

There are four graphs on the page, one for each of the operational interfaces (interfaces that were up and running when we ran cfgmaker) on our router. This page includes links to other pages that have more detailed information about individual interfaces;
Figure 13-2 shows the daily, weekly, monthly, and yearly traffic graphs for the Ethernet0 interface.

Figure 13-2

Figure 13-2. Daily, weekly, monthly, and yearly graphs for Etherenet0

The daily graph (which actually represents a 32-hour period) is the one that most people are interested in viewing. It shows the five-minute average of the traffic on this particular interface. Incoming traffic (ifInOctets) is represented by a green line; outgoing traffic (IfOutOctets) is represented by a blue line. If we had clicked on one of the other interfaces on the Cisco index page (Figure 13-1), we would have seen a similar graph.

That's all there is to viewing the graphs. MRTG stores the raw data it collects in flat-text-file format but, due to its intelligent log rolling capabilities, the log files don't grow out of control; their sizes remain quite manageable even if you use MRTG extensively.


Library Navigation Links

Copyright © 2002 O'Reilly & Associates. All rights reserved.