 |  |

Mac OS X comes with many tools for tweaking and spying on various aspects of your system, including memory, kernel modules, and kernel state variables. Some of these tools come directly from BSD, while others are unique to Mac OS X. Most of the BSD-derived utilities have been filtered through Mach and NeXTSTEP on their way to Mac OS X.
For more details on any of these utilities, see their respective manpages.
Mac OS X includes many diagnostic utilities that you can use to monitor your system and investigate problems.
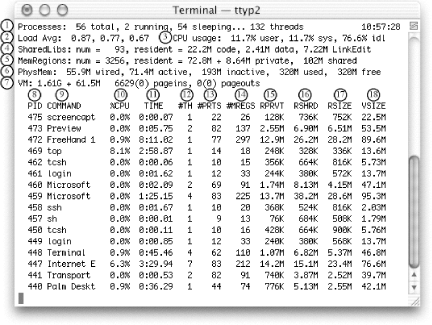
The top utility displays memory statistics and a list of running processes. It is divided into two regions: the top region contains memory statistics and the bottom region contains details on each process.
TIP: The Mac OS X version of top is based on the one used in early versions of BSD. It was ported to Mach in 1988, to NeXTSTEP in 1990, and to Mac OS X in 1999.
You can specify the number of processes to show by supplying a numeric argument. By default, top refreshes its display every second and sorts the list of processes by process ID (PID) in descending order. You can set top to sort by CPU utilization with -u, and you can specify the refresh delay with the -s option. Figure 8-1 shows the output of top -u 10 (if you wanted to refresh the output every 3 seconds, you could run top -s3 -u 10).

Table 8-1 describes the values shown in the top region, and Table 8-2 describes the columns in the bottom region (process information).
|
Item number |
Item |
Description |
|---|---|---|
1 |
Processes |
The number of processes and threads. A running process is currently using CPU time, while a sleeping process is not. |
2 |
Load Avg. |
The average system load (number of jobs vying for the CPU's attention) over the last 1, 5, and 15 minutes. |
3 |
CPU usage |
A breakdown of CPU usage, listing time spent in user mode, kernel (sys) mode, and idle time. |
4 |
SharedLibs |
The number of shared libraries in use, along with their memory utilization. |
5 |
MemRegions |
The number of Mach virtual memory regions in use, along with memory utilization details. |
6 |
PhysMem |
The physical memory utilization. Memory that is wired cannot be swapped to disk. active memory is memory that's currently being used, inactive memory is memory that Mac OS X is keeping "on deck" for processes that need it, and free memory is memory that's not being used at all. |
7 |
VM |
The virtual memory statistics, including the total amount of virtual memory allocated (the sum of the VSIZE in the process list), as well as paging activity (data paged in and out of physical memory). |
|
Item number |
Item |
Description |
|---|---|---|
8 |
PID |
Process ID |
9 |
COMMAND |
Program's name |
10 |
%CPU |
Percentage of the CPU that the process is using |
11 |
TIME |
Total amount of CPU time this process has used |
12 |
#TH |
Number of threads in this process |
13 |
#PRTS |
Number of Mach ports |
14 |
#MREGS |
Number of memory registers |
15 |
RPRVT |
Resident private memory |
16 |
RSHRD |
Resident shared memory |
17 |
RSIZE |
Resident memory |
18 |
VSIZE |
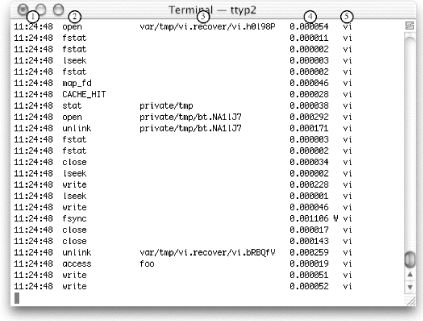
The fs_usage utility shows a continuous display of filesystem-related system calls and page faults. You must run fs_usage as root. By default, it ignores anything originating from fs_usage, Terminal, telnetd, sshd, rlogind, tcsh, csh, or sh.
Figure 8-2 shows the output of fs_usage, which displays the:
Timestamp
System call
Filename
Elapsed time
Name of the process
latency measures the number of context switches and interrupts, and reports on the resulting delays, updating the display once per second. This utility must be run as root. Example 8-1 shows a portion of its output.
Mon Apr  8 16:30:30                             0:01:58
                     SCHEDULER     INTERRUPTS
---------------------------------------------
total_samples            64431         179982

delays <  10 usecs       38731         176120
delays <  20 usecs       10763           2885
delays <  30 usecs        2934            447
delays <  40 usecs        1037            190
delays <  50 usecs         718             93
delays <  60 usecs         708             41
delays <  70 usecs         540             32
delays <  80 usecs         420             21
delays <  90 usecs         310             30
delays < 100 usecs         217             20
total  < 100 usecs       56378         179879
The SCHEDULER column lists the number of context switches and the INTERRUPTS column lists the number of interrupts.
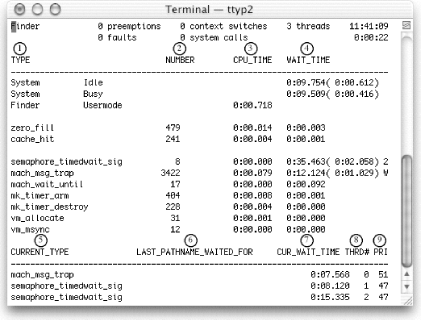
The sc_usage utility samples system calls and page faults, displaying them onscreen. sc_usage must be run by root or by someone who has superuser privileges. The display is updated once per second. You must specify a PID, a command name, or a program to execute with the -E switch. For example, to monitor the Finder, use sc_usage Finder. Figure 8-2 shows the output of running sc_usage on the Finder. Table 8-3 explains sc_usage's output.

|
Item number |
Row |
Description |
|---|---|---|
1 |
TYPE |
The system call type |
2 |
NUMBER |
The system call count |
3 |
CPU_TIME |
The processor time used by the system call |
4 |
WAIT_TIME |
The absolute time that the process spent waiting |
5 |
CURRENT_TYPE |
The current system call type |
6 |
LAST_PATHNAME_WAITED_FOR |
The last file or directory that resulted in a blocked I/O operation during a system call |
7 |
CUR_WAIT_TIME |
The cumulative time spent blocked |
8 |
THRD# |
The thread ID |
9 |
PRI |
The scheduling priority |
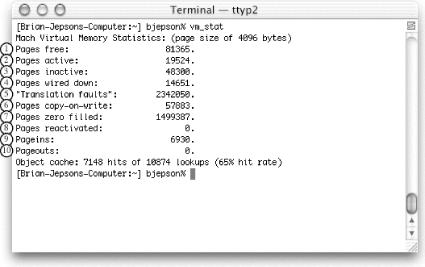
The vm_stat utility displays virtual memory statistics. Unlike implementations of vm_stat in other Unix systems, it does not default to continuous display. Instead, it displays accumulated statistics.
To obtain a continuous display, specify an interval argument (in seconds), as in vm_stat 1. Figure 8-3 shows the output of vm_stat with no arguments, and Figure 8-4 shows the output of vm_stat 1. Table 8-4 describes the information that vm_stat displays (the item numbers correspond to the callouts in both figures).


|
Item number |
Accumulated mode |
Continuous mode |
Description |
|---|---|---|---|
1 |
Pages free |
free |
Total free pages |
2 |
Pages active |
active |
Total pages in use that can be paged out |
3 |
Pages inactive |
inac |
Total inactive pages |
4 |
Pages wired down |
wire |
Total pages wired into memory (cannot be paged out) |
5 |
Translation Faults |
faults |
Number of times vm_fault has been called |
6 |
Pages copy-on-write |
copy |
Number of faults that resulted in a page being copied |
7 |
Pages zero filled |
zerofill |
Number of pages that have been zero-filled |
8 |
Pages Reactivated |
reactive |
Number of pages reclassified from inactive to active |
9 |
Pageins |
pagein |
Number of pages moved into physical memory |
10 |
Pageouts |
pageout |

Copyright © 2003 O'Reilly & Associates. All rights reserved.