

|
|
10.1 Setting a BreakpointTo get started with the debugger, return to Example 9-1. Put a breakpoint on the first line of Main() to see how this code actually works. A breakpoint is an instruction to the debugger to stop running. You set a breakpoint and then run the program and the debugger runs the program up until the breakpoint. Then you have the opportunity to examine the value of your variables at this point in the execution. Examining your program as it runs can help you untangle otherwise impenetrable problems. It is common to set multiple breakpoints, which allows you to zip through your program, examining the state of your object at selected locations. You can set a breakpoint in many different ways. The easiest is to click in the far-left margin. This causes a red dot to appear in the margin next to the relevant line of code, which is also highlighted in red, as shown in Figure 10-1. Notice that as you hover over the breakpoint it tells you the line on which the breakpoint appears. Figure 10-1. Setting a breakpoint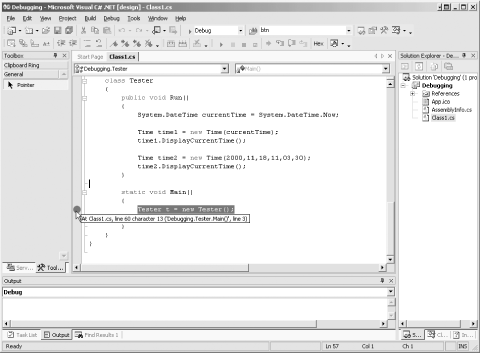 You are now ready to run the program to the breakpoint. Again, there are a number of ways to do so. You can click on the Start button (see Figure 4-6), or you can choose the Start item from the Debug menu (or use the keyboard shortcut for the menu item, the F5 key). In any case, the program starts and runs to the breakpoint, as shown in Figure 10-2. Figure 10-2. At the breakpoint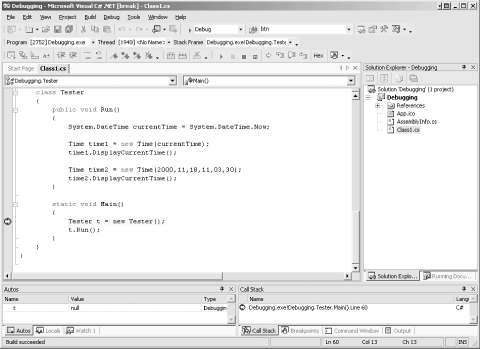 The next statement to be executed is highlighted (in this case, the instantiation of the Tester object). There are a number of other helpful windows open as well, which will be examined in detail. To step into the code, press the F11 function key twice. With the first keypress, the Tester is created. The second keypress moves you to the next line in the code, which calls the Run() method. Press the key once more to step inside the code for the Run() method and assign the value of System.DateTime.Now to the currentTime variable.
10.1.1 Using the Debug Menu to Set Your BreakpointRather than clicking in the margin to set your breakpoint, you can use the New Breakpoint item on the Debug menu (or use the keyboard shortcut for the menu item, Control-B). This brings up the New Breakpoint dialog box, as shown in Figure 10-3. Figure 10-3. The New Breakpoint dialog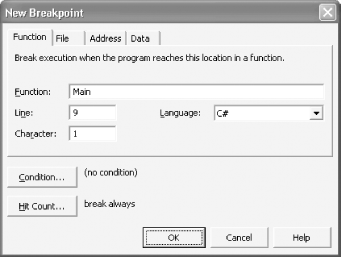 The New Breakpoint dialog gives you far greater control over your breakpoint. For example, you can set it to break only when a specific condition is hit (e.g., when counter > 10). You can also set the hit count to designate that you only want the debugger to break in when the line has been hit a specified number of times (or a multiple of a specific number, etc.), as shown in Figure 10-4. Figure 10-4. Breakpoint hit count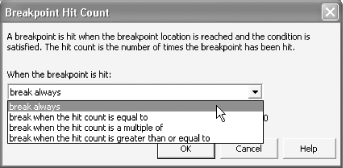 This can be very useful when you are in a loop (as described in Chapter 6). Rather than breaking each time through a loop of 100 iterations, you can choose the conditions under which to break. You can also examine and manipulate all the breakpoints together in the breakpoint window, as shown in Figure 10-5. Figure 10-5. The Breakpoints window 10.1.2 Examining Values: The Autos and Locals WindowsLook at the bottom left-hand windows, where your variables are displayed. These variables are organized in windows named Autos and Locals, as shown in Figure 10-6.
You can use the Autos and Locals windows to display the current value of each variable (and parameter) in your program. The Autos window shows variables used in the current statement and the previous statement. (The current statement is the statement at the current execution location, which is highlighted automatically in the debugger -- thus the window's name.) The Locals window displays all the variables in the current method, including parameters. In Figure 10-6, the Autos window shows you that the current time has been set to the current date. Figure 10-6. The Autos window Since the value of currentTime has just been set it is shown in red. Notice the plus sign (+) next to the currentTime variable. This variable is of type System.DateTime, which is a type with many members. Expanding the plus sign reveals the state of this object, as shown in Figure 10-7. Figure 10-7. Expanding the variable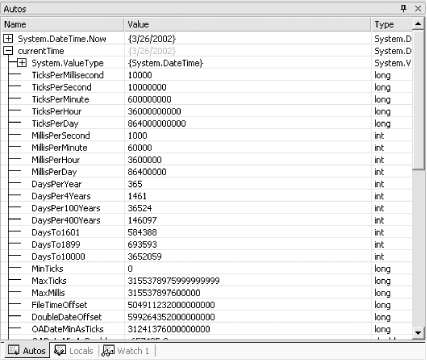 Press F11 again to step into the Time class constructor. When you step into the Time constructor, the Autos window changes to show you the new values, appropriate to the current line of code. The debugger also provides a way for you to look at all the variables in the current method simultaneously: the Locals window. In this series of examples, clicking on the Locals window reveals the local variables dt (the parameter) and this (the current object). Expand the this variable and you'll see the Time object, with its controls uninitialized. Press F11 to progress through the assignment of values to the member variables of the Time class. As you hit the F11 key, the update is reflected in the Locals window, as shown in Figure 10-8. Figure 10-8. Watching assignment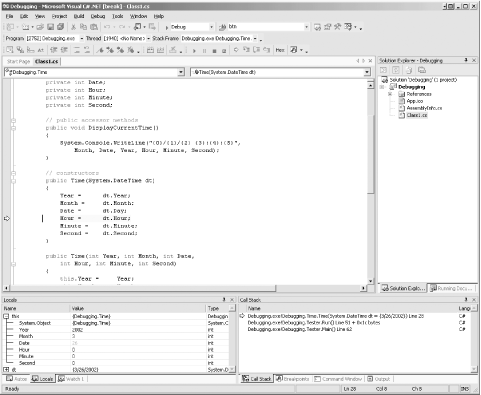 Explore the Locals and Autos windows as you step through the program. When you want to stop, choose the Stop debugging item from the Debug menu to stop processing and return to the editor. 10.1.3 Set Your WatchIn a program with many local variables, it can be difficult to keep track of the particular variables you want to keep an eye on. You can track variables and objects in the Watch window. You can have up to four Watch windows at a time. Watch windows are like by-invitation versions of the Locals window; they list the objects you ask the debugger to keep an eye on, and you can see their values change as you step through the program, as illustrated in Figure 10-9. Figure 10-9. A Watch window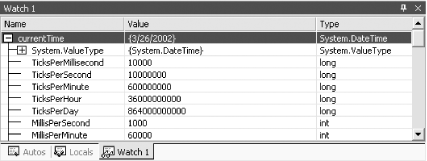 The Watch windows are usually tabbed with the Locals window. You can create more than one Watch window to organize the variables you keep an eye on. You can add a watch by right-clicking on a variable and choosing Add Watch. You might instead choose Add QuickWatch, which opens a dialog box with watch information about a single object, as shown in Figure 10-10. Figure 10-10. QuickWatch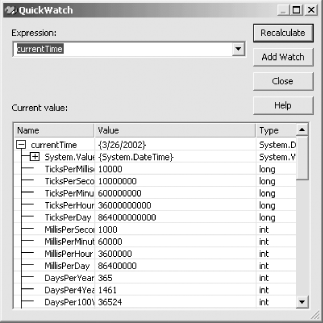 You can enter any expression and evaluate it from within the QuickWatch window. For example, suppose you had integer variables named varOne and varTwo: int varOne = 5; int varTwo = 7; If you want to know the impact of multiplying them, enter: varOne * varTwo into the Expression window and click Recalculate. The value is shown in the Current value window, as in Figure 10-11. Figure 10-11. QuickWatch recalculation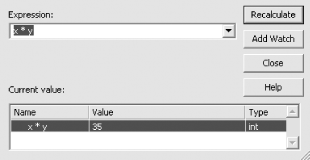 |

|
|